What are Math Anchor Charts?
Math anchor charts are posters that visually capture important parts of a lesson or topic. They are often placed on the wall for an extended period of time so students can refer to them.
They may include the following:
- Definitions
- Examples
- Visual representations
- Key concepts
- Categorized information
- Continual exposure to content
- Help connect math concepts by referring to old concepts while teaching new concepts
- Promote independent work
- Trigger memory of content
- Launch new content
Creating Math Anchor Charts
I suggest making anchor charts as a class activity. You can have the basics of the charts created before class, but having students add examples and definitions is a great teaching tool. If you teach just one class of math, then you can hang up the class made anchor chart on the wall to refer to continually.
The problem that I ran into when I was teaching, is that I taught the same class four separate times. Yes, I would make a new anchor chart for each class. However, I didn't feel that it was effective to hang up all the anchor charts from each class period.
So, while I would make a separate anchor chart for each class as an activity. I would create one well-done anchor chart with the necessary information and hang that on the wall. This way, the anchor chart was easy to read for all students.
Math Anchor Charts Made For YOU
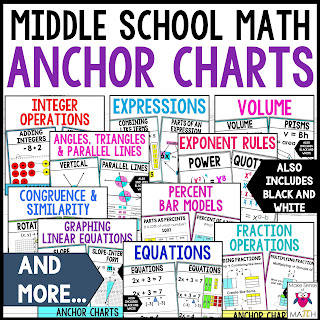
If you don't have time to make quality math anchor charts to hang on your wall, then check out these anchor charts for middle school math. These work great for 6th grade math, 7th grade math, and 8th grade math.
Save This Article


